Produced from 1985-1997, the Onkyo 9090 FM tuner is the best FM tuner Onkyo ever produced (with the exception of a rare model that is very similar). The 1990s being the golden age of FM tuners. After that the mass market moved toward home theater and digital sound sources, leaving the 1990s with tuners that remain outstanding even today. It has excellent sound quality and is able to pull in weak signals better than almost any tuner of that era or today, at least for under $800. Magnum Dynalab has an excellent line of very expensive and performant FM tuners today–but I think their cheapest model is around $800.
I have purchased three of these from Ebay, and one thing they all have in common is that the large power supply capacitor next to a voltage regulator have blown out over the years. Two of the units had electrolyte from the capacitors on the circuit board, and the one I will talk about today had been sloppily repaired with an axial capacitor replacing the large cap which presumably blew sometime in the previous decades. The problem with the 9090 is a design flaw from Onkyo, where a physically large capacitor is too close to the heat sink of a voltage regulator, which roasts it.
When I get a 9090 used, they normally have spilled and baked on electrolyte from this capacitor. I am able to remove the crust by scraping it with a piece of wood and clean it with alchohol. Even in this degraded state, the tuner still works, but there is no need for me to leave it in that degraded state.
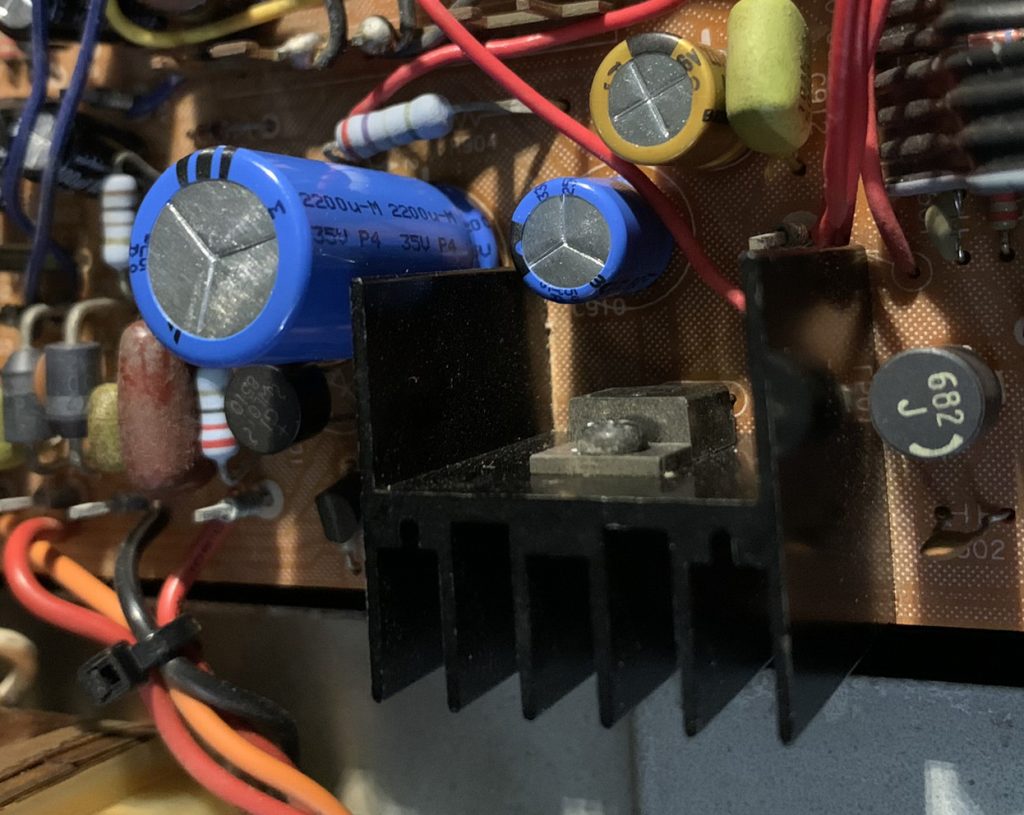
In this unit, I replaced all of the electrolytics, and ensured that the capacitors closest to the heat sink were rated for 125 degrees centigrade. I also thought about ways to increase the surface area of the heat sink, and ultimately decided to use a thermally conductive epoxy to glue two heat pipes onto it. The photo below shows the positioning of the voltage regulator heat sink and the capacitor, which runs at about 63 degrees centigrade according to my inexpensive infrared thermometer. I also note that the chassis of the 9090 has almost nothing in terms of ventilation and airflow past these hot parts.
This is what it looks like after I added the heat pipes. Again, not very scientific, but the heat sink appears to be running at 53 degrees centigrade with the heat pipes, a 10 degree improvement. 50/60 degrees does not seem very hot compared to caps rated for 85-125 degrees, but these measurements are before the top is put on the tuner and airflow will be reduced. Also, a 125 degree cap is rated for that temperature for something like 2000 to 400 hours. For electrolytics, heat is their mortal enemy, but I think the higher rated caps have a chemical paste inside that is formulated to tolerate higher temperatures longer than a typical 85 degree cap would. Presumably cap technology has also improved in the last 30 some years. When I do a re-cap, I typically select the most expensive cap that meets the electrical requirements, so I hope that improves the situation overall.
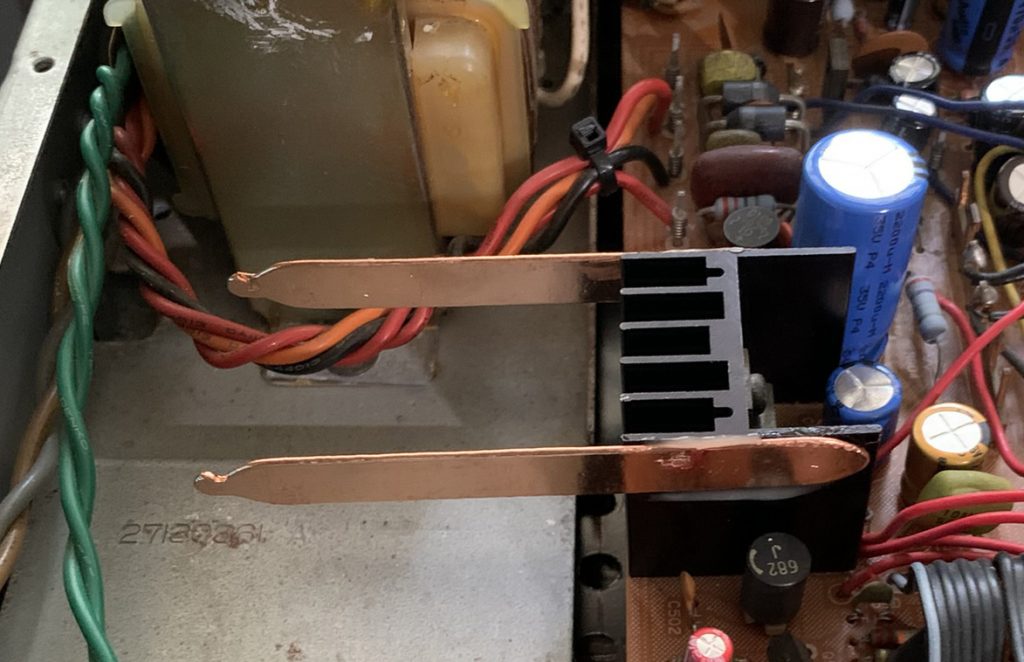
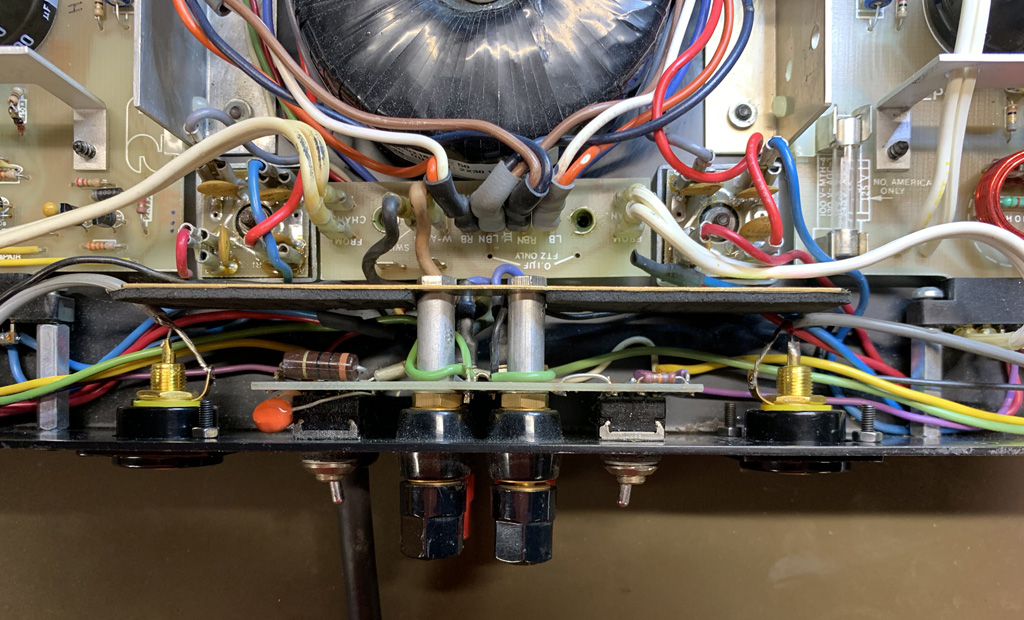
The heatpipes glued on. The dark spots are reflections in the light, not discoloration of the metal. I hope that the heatpipes are more effective than simply pieces of copper, but no way of knowing.
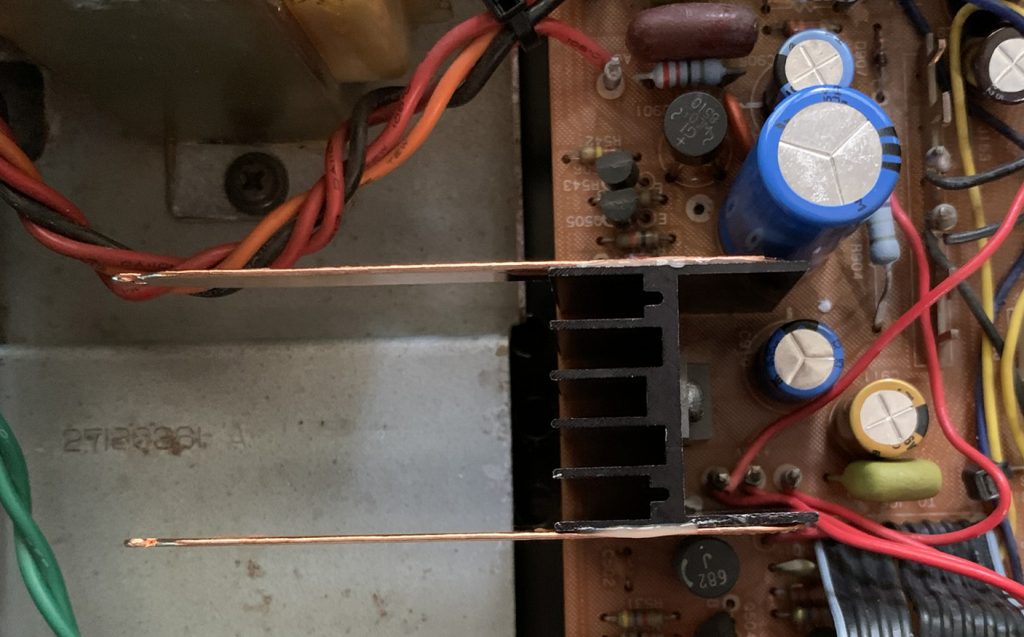
The view from the top–showing how close that cap is to the heat sink.
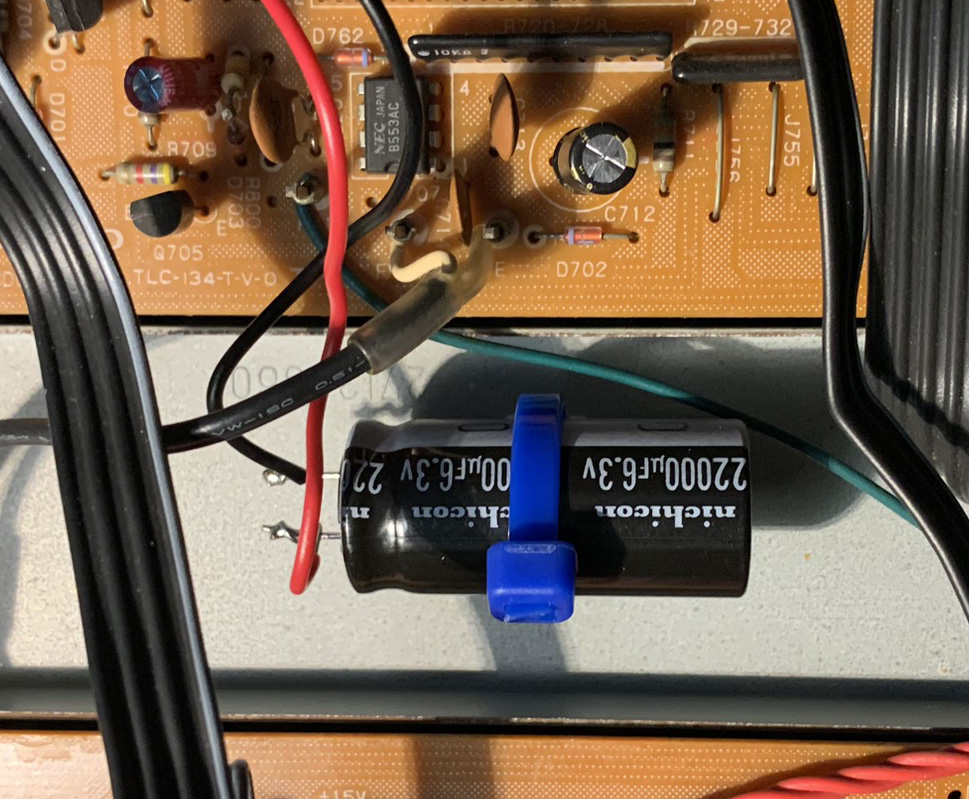
Another interesting aspect about re-capping this was a 22,000 uf capacitor that retains the presets when the unit is not plugged in. The original cap was the diameter of a dime and maybe 3/4 inch tall. I could not find a 220,000 uf cap of such small dimensions, so I got the size that was available and physically mounted it on some spare chassis space, since it is too tall to go in the PCB where the original one was. I missed this cap the first time I ordered parts because it was specified as something like .022 f. I thought it was .022 uf and would not be an electrolytic. After taking a closer look, I realized I missed the fact it was specified in farads–I have never seen that before in a schematic or parts list.
That’s about all I can say about fixing up my 9090. Its a monster in terms of physical size, it has great RF performance, and sounds great as well. Its clarity shows the overly compressed and greatly degraded sound quality in most pop and rock stations. Only our local jazz station, 88.5 and classical music station 99.5 demonstrate how wonderful FM can sound.